

Within ACA, there are multiple teams working on different (or the same!) projects. Every team has their own domains of expertise, such as developing custom software, marketing and communications, mobile development and more. The teams specialized in Atlassian products and cloud expertise combined their knowledge to create a highly-available Atlassian stack on Kubernetes. Not only could we improve our internal processes this way, we could also offer this solution to our customers!
In this blogpost, we’ll explain how our Atlassian and cloud teams built a highly-available Atlassian stack on top of Kubernetes. We’ll also discuss the benefits of this approach as well as the problems we’ve faced along the path. While we’re damn close, we’re not perfect after all 😉 Lastly, we’ll talk about how we monitor this setup.
The setup of our Atlassian stack
Our Atlassian stack consists of the following products:
- Amazon EKS
- Amazon EFS
- Atlassian Jira Data Center
- Atlassian Confluence Data Center
- Amazon EBS
- Atlassian Bitbucket Data Center
- Amazon RDS
As you can see, we use AWS as the cloud provider for our Kubernetes setup. We create all the resources with Terraform. We’ve written a separate blog post on what our Kubernetes setup exactly looks like. You can read it here! The image below should give you a general idea.

The next diagram should give you an idea about the setup of our Atlassian Data Center.

While there are a few differences between the products and setups, the core remains the same.
- The application is launched as one or more pods described by a StatefulSet. The pods are called node-0 and node-1 in the diagram above.
- The first request is sent to the load balancer and will be forwarded to either the node-0 pod or the node-1 pod. Traffic is sticky, so all subsequent traffic from that user will be sent to node-1.
- Both pod-0 and pod-1 require persistent storage which is used for plugin cache and indexes. A different Amazon EBS volume is mounted on each of the pods.
- Most of the data like your JIRA issues, Confluence spaces, … is stored in a database. The database is shared, node-0 and node-1 both connect to the same database. We usually use PostgreSQL on Amazon RDS.
- The node-0 and node-1 pod also need to share large files which we don’t want to store in a database, for example attachments. The same Amazon EFS volume is mounted on both pods. When changes are made, for example an attachment is uploaded to an issue, the attachment is immediately available on both pods.
- We use CloudFront (CDN) to cache static assets and improve the web response times.
The benefits of this setup
By using this setup, we can leverage the advantages of Docker and Kubernetes and the Data Center versions of the Atlassian tooling. There are a lot of benefits to this kind of setup, but we’ve listed the most important advantages below.
- It’s a self-healing platform: containers and worker nodes will automatically replace themselves when a failure occurs. In most cases, we don’t even have to do anything and the stack takes care of itself. Of course, it’s still important to investigate any failures so you can prevent them from occurring in the future.
- Exactly zero downtime deployments: when upgrading the first node within the cluster to a new version, we can still serve the old version to our customers on the second. Once the upgrade is complete, the new version is served from the first node and we can upgrade the second node. This way, the application stays available, even during upgrades.
- Deployments are predictable: we use the same Docker container for development, staging and production. It’s why we are confident the container will be able to start in our production environment after a successful deploy to staging.
- Highly available applications: when failure occurs on one of the nodes, traffic can be routed to the other node. This way you have time to investigate the issue and fix the broken node while the application stays available.
- It’s possible to sync data from one node to the other. For example, syncing the index from one node to the other to fix a corrupt index can be done in just a few seconds, while a full reindex can take a lot longer.
- You can implement a high level of security on all layers (AWS, Kubernetes, application, …)
- AWS CloudTrail prevents unauthorized access on AWS and sends an alert in case of anomaly.
- AWS Config prevents AWS security group changes. You can find out more on how to secure your cloud with AWS Config in our blog post.
- Terraform makes sure changes on the AWS environment are approved by the team before rollout.
- Since upgrading Kubernetes master and worker nodes has little to no impact, the stack is always running a recent version with the latest security patches.
- We use a combination of namespacing and RBAC to make sure applications and deployments can only access resources within their namespace with least privilege.
- NetworkPolicies are rolled out using Calico. We deny all traffic between containers by default and only allow specific traffic.
- We use recent versions of the Atlassian applications and implement Security Advisories whenever they are published by Atlassian.

Interested in leveraging the power of Kubernetes yourself? You can find more information about how we can help you on our website!
Problems we faced during the setup
Migrating to this stack wasn’t all fun and games. We’ve definitely faced some difficulties and challenges along the way. By discussing them here, we hope we can facilitate your migration to a similar setup!
- Some plugins (usually older plugins) were only working on the standalone version of the Atlassian application. We needed to find an alternative plugin or use vendor support to have the same functionality on Atlassian Data Center.
- We had to make some changes to our Docker containers and network policies (i.e. firewall rules) to make sure both nodes of an application could communicate with each other.
- Most of the applications have some extra tools within the container. For example, Synchrony for Confluence, ElasticSearch for BitBucket, EazyBI for Jira, and so on. These extra tools all needed to be refactored for a multi-node setup with shared data.
- In our previous setup, each application was running on its own virtual machine. In a Kubernetes context, the applications are spread over a number of worker nodes. Therefore, one worker node might run multiple applications. Each node of each application will be scheduled on a worker node that has sufficient resources available. We needed to implement good placement policies so each node of each application has sufficient memory available. We also needed to make sure one application could not affect another application when it asks for more resources.
- There were also some challenges regarding load balancing. We needed to create a custom template for nginx ingress-controller to make sure websockets are working correctly and all health checks within the application are reporting a healthy status. Additionally, we needed a different load balancer and URL for our BitBucket SSH traffic compared to our web traffic to the BitBucket UI.
- Our previous setup contained a lot of data, both on filesystem and in the database. We needed to migrate all the data to an Amazon EFS volume and a new database in a new AWS account. It was challenging to find a way to have a consistent sync process that also didn’t take too long because during migration, all applications were down to prevent data loss. In the end, we were able to meet these criteria and were able to migrate successfully.

Monitoring our Atlassian stack
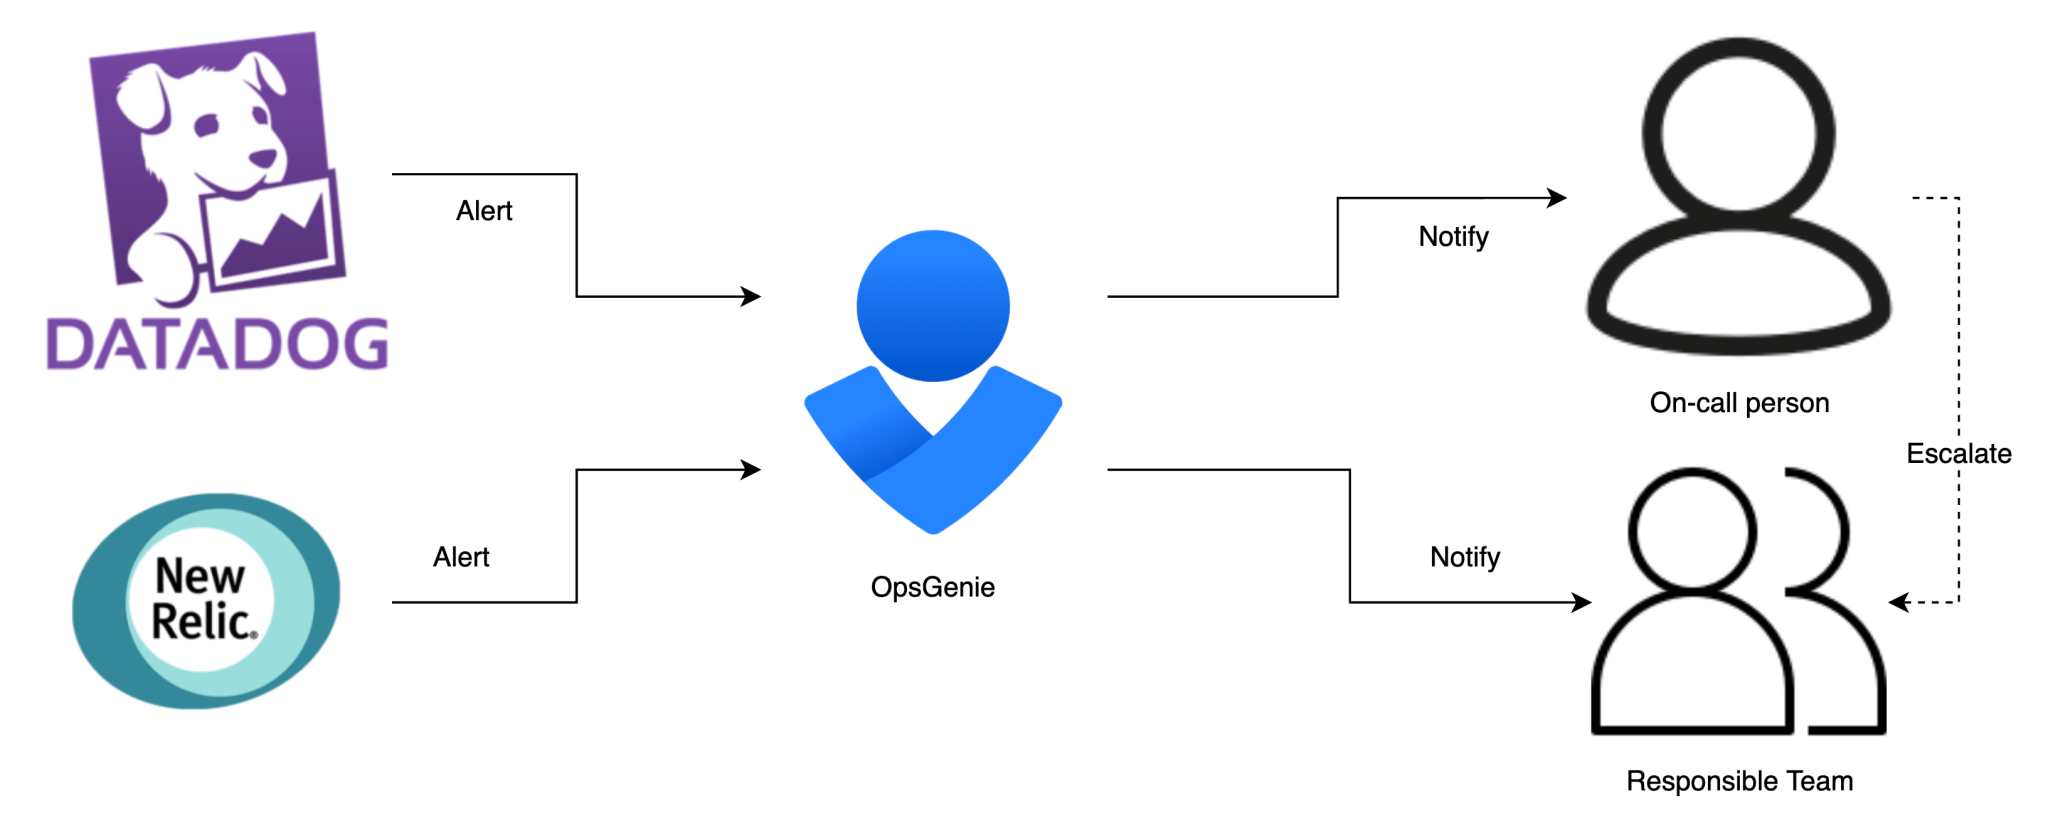
We use the following tools to monitor all resources within our setup
- Datadog to monitor all components created within our stack and to centralize logging of all components. You can read more about monitoring your stack with Datadog in our blog post here.
- NewRelic for APM monitoring of the Java process (Jira, Confluence, Bitbucket) within the container.
If our monitoring detects an anomaly, it creates an alert within OpsGenie. OpsGenie will make sure that this alert is sent to the team or the on-call person that is responsible to fix the problem. If the on-call person does not acknowledge the alert in time, the alert will be escalated to the team that’s responsible for that specific alert.

Conclusion
In short, we are very happy we migrated to this new stack. Combining the benefits of Kubernetes and the Atlassian Data Center versions of Jira, Confluence and BitBucket feels like a big step in the right direction. The improvements in self-healing, deploying and monitoring benefits us every day and maintenance has become a lot easier.
Interested in your own Atlassian Stack? Do you also want to leverage the power of Kubernetes? You can find more information about how we can help you on our website!


What others have also read


In the complex world of modern software development, companies are faced with the challenge of seamlessly integrating diverse applications developed and managed by different teams. An invaluable asset in overcoming this challenge is the Service Mesh. In this blog article, we delve into Istio Service Mesh and explore why investing in a Service Mesh like Istio is a smart move." What is Service Mesh? A service mesh is a software layer responsible for all communication between applications, referred to as services in this context. It introduces new functionalities to manage the interaction between services, such as monitoring, logging, tracing, and traffic control. A service mesh operates independently of the code of each individual service, enabling it to operate across network boundaries and collaborate with various management systems. Thanks to a service mesh, developers can focus on building application features without worrying about the complexity of the underlying communication infrastructure. Istio Service Mesh in Practice Consider managing a large cluster that runs multiple applications developed and maintained by different teams, each with diverse dependencies like ElasticSearch or Kafka. Over time, this results in a complex ecosystem of applications and containers, overseen by various teams. The environment becomes so intricate that administrators find it increasingly difficult to maintain a clear overview. This leads to a series of pertinent questions: What is the architecture like? Which applications interact with each other? How is the traffic managed? Moreover, there are specific challenges that must be addressed for each individual application: Handling login processes Implementing robust security measures Managing network traffic directed towards the application ... A Service Mesh, such as Istio, offers a solution to these challenges. Istio acts as a proxy between the various applications (services) in the cluster, with each request passing through a component of Istio. How Does Istio Service Mesh Work? Istio introduces a sidecar proxy for each service in the microservices ecosystem. This sidecar proxy manages all incoming and outgoing traffic for the service. Additionally, Istio adds components that handle the incoming and outgoing traffic of the cluster. Istio's control plane enables you to define policies for traffic management, security, and monitoring, which are then applied to the added components. For a deeper understanding of Istio Service Mesh functionality, our blog article, "Installing Istio Service Mesh: A Comprehensive Step-by-Step Guide" , provides a detailed, step-by-step explanation of the installation and utilization of Istio. Why Istio Service Mesh? Traffic Management: Istio enables detailed traffic management, allowing developers to easily route, distribute, and control traffic between different versions of their services. Security: Istio provides a robust security layer with features such as traffic encryption using its own certificates, Role-Based Access Control (RBAC), and capabilities for implementing authentication and authorization policies. Observability: Through built-in instrumentation, Istio offers deep observability with tools for monitoring, logging, and distributed tracing. This allows IT teams to analyze the performance of services and quickly detect issues. Simplified Communication: Istio removes the complexity of service communication from application developers, allowing them to focus on building application features. Is Istio Suitable for Your Setup? While the benefits are clear, it is essential to consider whether the additional complexity of Istio aligns with your specific setup. Firstly, a sidecar container is required for each deployed service, potentially leading to undesired memory and CPU overhead. Additionally, your team may lack the specialized knowledge required for Istio. If you are considering the adoption of Istio Service Mesh, seek guidance from specialists with expertise. Feel free to ask our experts for assistance. More Information about Istio Istio Service Mesh is a technological game-changer for IT professionals aiming for advanced control, security, and observability in their microservices architecture. Istio simplifies and secures communication between services, allowing IT teams to focus on building reliable and scalable applications. Need quick answers to all your questions about Istio Service Mesh? Contact our experts
Read more

On December 7 and 8, 2023, several ACA members participated in CloudBrew 2023 , an inspiring two-day conference about Microsoft Azure. In the scenery of the former Lamot brewery, visitors had the opportunity to delve into the latest cloud developments and expand their network. With various tracks and fascinating speakers, CloudBrew offered a wealth of information. The intimate setting allowed participants to make direct contact with both local and international experts. In this article we would like to highlight some of the most inspiring talks from this two-day cloud gathering: Azure Architecture: Choosing wisely Rik Hepworth , Chief Consulting Officer at Black Marble and Microsoft Azure MVP/RD, used a customer example in which .NET developers were responsible for managing the Azure infrastructure. He engaged the audience in an interactive discussion to choose the best technologies. He further emphasized the importance of a balanced approach, combining new knowledge with existing solutions for effective management and development of the architecture. From closed platform to Landing Zone with Azure Policy David de Hoop , Special Agent at Team Rockstars IT, talked about the Azure Enterprise Scale Architecture, a template provided by Microsoft that supports companies in setting up a scalable, secure and manageable cloud infrastructure. The template provides guidance for designing a cloud infrastructure that is customizable to a business's needs. A critical aspect of this architecture is the landing zone, an environment that adheres to design principles and supports all application portfolios. It uses subscriptions to isolate and scale application and platform resources. Azure Policy provides a set of guidelines to open up Azure infrastructure to an enterprise without sacrificing security or management. This gives engineers more freedom in their Azure environment, while security features are automatically enforced at the tenant level and even application-specific settings. This provides a balanced approach to ensure both flexibility and security, without the need for separate tools or technologies. Belgium's biggest Azure mistakes I want you to learn from! During this session, Toon Vanhoutte , Azure Solution Architect and Microsoft Azure MVP, presented the most common errors and human mistakes, based on the experiences of more than 100 Azure engineers. Using valuable practical examples, he not only illustrated the errors themselves, but also offered clear solutions and preventive measures to avoid similar incidents in the future. His valuable insights helped both novice and experienced Azure engineers sharpen their knowledge and optimize their implementations. Protecting critical ICS SCADA infrastructure with Microsoft Defender This presentation by Microsoft MVP/RD, Maarten Goet , focused on the use of Microsoft Defender for ICS SCADA infrastructure in the energy sector. The speaker shared insights on the importance of cybersecurity in this critical sector, and illustrated this with a demo demonstrating the vulnerabilities of such systems. He emphasized the need for proactive security measures and highlighted Microsoft Defender as a powerful tool for protecting ICS SCADA systems. Using Azure Digital Twin in Manufacturing Steven De Lausnay , Specialist Lead Data Architecture and IoT Architect, introduced Azure Digital Twin as an advanced technology to create digital replicas of physical environments. By providing insight into the process behind Azure Digital Twin, he showed how organizations in production environments can leverage this technology. He emphasized the value of Azure Digital Twin for modeling, monitoring and optimizing complex systems. This technology can play a crucial role in improving operational efficiency and making data-driven decisions in various industrial applications. Turning Azure Platform recommendations into gold Magnus Mårtensson , CEO of Loftysoft and Microsoft Azure MVP/RD, had the honor of closing CloudBrew 2023 with a compelling summary of the highlights. With his entertaining presentation he offered valuable reflection on the various themes discussed during the event. It was a perfect ending to an extremely successful conference and gave every participant the desire to immediately put the insights gained into practice. We are already looking forward to CloudBrew 2024! 🚀
Read more

Atlassian offers great ways to resolve the need many companies have for billing and invoicing. The Atlassian Marketplace showcases numerous add-ons that integrate with Jira to help with that need. These add-ons can be extremely powerful, for example ending the need to compile numerous Excel sheets or gather paper files to invoice a client. Tempo Timesheets is an award-winning time-tracking add-on for Jira that benefits customers with real-time and accurate invoicing functions. In this guest blog post by Tempo’s Maxime-Samuel Nie-Rouquette, we track Paul’s steps to invoice a new client through Tempo Timesheets and the best practices that Paul applies to maximize the benefits he reaps from the add-on. Quick introduction Paul takes care of sending invoices to clients for his team’s R D efforts. Before using Tempo Timesheets, Paul was using the honor system to calculate the total compensation. The honor system created numerous problems with clients due to the lack of accuracy and transparency, and was quickly dropped for a more practical solution. Step 1 – Adding a Customer Paul’s new client, Soylent Corp, has signed an agreement with Paul’s company to create a new product, Soylent Green. Whenever a new customer comes around, Paul’s first step is to create a new customer in order to have an organized report throughout the progression of a project. Paul starts the invoicing process by creating a customer account so that he will be able to analyze the time his team spends on billable and non-billable issues for that particular customer. The ‘Accounts’ tab is a functionality unique to Tempo Timesheets and is very powerful. In essence, it allows you to improve the reliability, transparency, and accuracy of time tracked for clients across multiple projects and teams. Any new projects from a client can easily be added to their account. To create a customer account for Soylent Corp, Paul navigates to the ‘Accounts’ page from the Tempo Timesheets menu at the top of the page. In the upper-right corner of the screen, the ‘Customer’ tab is where new customers are added. In this case, Paul adds Soylent Corp in the ‘Name’ field and SOY in the ‘Key’ field. Step 2 – Creating Account Categories Accounts In order to fully benefit from the accounts, Paul needs to create account categories. These categories enable Tempo Timesheets to identify if the time spent is billable or non-billable, and are used in conjunction with accounts to properly showcase and organize data in reports. The first account category Paul creates is “RND”, for research and development, which Paul’s team identifies as billable work. For example, if the team works on a mathematical model to search for the best nutrients for Soylent Green, they would track the activity as billable as it falls into “RND”. Paul also creates “TRN”, for training, which is classified as non-billable work by Paul’s company. In the event that new members are added to the team and need to be worked in, the training time would be deemed non-billable as it would fall under “TRN”. To access and add new account categories, Paul navigates clicks the ‘Account Categories’ tab found under the ‘Accounts’ section of the settings menu. In this case, Paul adds ‘RND’ as the key, ‘Research and Development’ as the name, and classifies it as a Billable type. For ‘Training’, Paul repeats the process, but adds ‘internal’ as the type. With the two account categories now created (RND and TRN), it’s best practice to create accounts so that the time is rightfully associated and the data is accurate during the reporting/invoicing process. Previously, Paul created account categories to help the system categorise the type/nature of the activities. Now Paul includes that information in the Account so it’s easy to understand the nature of the work, who it is for, which projects are included in the account, and so on. Because Paul created 2 account categories (one billable and one non-billable), he does the same for the accounts: one billable and one non-billable. As such, the accounts have the following information: Going back to the account page, Paul adds the two accounts by clicking the create account button at the top right section of the page. When the account window appears all that is left to do is to fill in the right information: Name + Key: Name and tag for the account (Soylent Billable +SOYLENTBIL) Lead: Key person for the account (Paul) Category: the account category for this (Research and Development) Customer: name of the customer (Soylent Corp) Contact: Key Contact at the Customer’s Company (Amy) Projects: Collects all issues where there is billable logged time (Azome) Paul repeats the process for the non-billable account: Paul has now successfully created the necessary foundation for Paul’s team to have their logged time show under the right categories and fields – in real-time! Step 3 - Logging time Now that the foundation has been laid, Paul and his team need to log their time in order to offer the transparency and accuracy that they seek to offer. There are multiple ways to track time and have that time be associated with billable and non-billable time for a customer/project. It all depends on the way a company is set-up to operate and track time. In this case we simply modified the ‘billable’ and ‘non-billable’ hours in the worklog window. For Paul’s company, everyone is able to track billable and non-billable hours. For example, Taylor worked 8h today on a modelization task, but deemed that only 7h were billable, because she was doing 1h of relevant menial tasks that she deemed non-billable. The biggest challenge that Paul now faces is to have his team accurately and consistently track and log their time. Here are some best practices. Paul could ask his system admin to approve timesheets on a monthly frequency, as a way to ‘force’ the team to correctly track time. The team can use the real-time tracker found in the Tempo submenu (‘Tracker’). Using this method, users can simply pause the timer of the tracker when they get interrupted during the day (calls, unplanned meetings, breaks, etc.), or stop the timer to prompt the worklog window to automatically appear with the time already filled in. Paul’s team can also open the worklog dialog using the associated window hotkey. When the hotkey is pressed anywhere in Jira, the worklog window will appear to let the user log their time. This is convenient for users if they want to quickly log their time once they’re done working on something. Step 4 – Creating the custom report for the customer’s invoice Once the project is complete or when it is time to showcase some progress, Paul can easily create a report. A report displays the time spent on issues, both billable and non-billable, and updates all that information in real-time. It’s been a month since the start of the project and Soylent Corp is requesting their monthly invoice, which also doubles as a report. Paul’s team spent 291 hours this month working on the project, but only 237 hours are billable. Paul might still want to show this metric to Soylent Corp to show that the team has been spending time behind the scenes to better serve the client. Through the custom report, Paul can now have a breakdown of the hours his team worked for Soylent Corp this month. Paul can create a custom report either from the Tempo submenu at the top of the page or via the icon on the left side of the page. In this case, he only wants to display the information for the month of April relevant for Soylent Corp and easily filters by Soylent Corp. Because Paul is interested in showing both the billable and non-billable tasks worked on this month, he groups by Account + Issues. Finally, to have an understanding of the breakdown of billable and non-billable time and the total sum for each, Paul adds the billable column (found in the grid view). 🚀 Takeaway Paul was able to create the foundation and promote some practices to his team so that he would easily be able to provide his client with accurate and transparent information at the click of a button. Unsurprisingly, this method is vastly superior to the honour system as it works within Jira, so it is also very convenient for his team to track the time (as it is the same environment they work with on a daily basis). In the end, there is great value for Paul and his company in the time that is being saved internally as a result of tracking time consistently. The steps above offer a very simple way of setting up Tempo Timesheets to create some invoices. However, every company has their own unique ways of operating and tracking time, so the method explored today might not be sufficient for the needs of your company. If you’d like to better understand how this could fit with your internal methodology, we recommend visiting Tempo.io or connecting with our customer support so that they can provide their guidance to optimize your business practice with Tempo Timesheets. About Tempo timesheets Tempo Timesheets is a time-tracking and reporting solution that seamlessly integrates with Jira to help teams and managers track time for accounting, payroll, client billing, compliance, enhanced efficiency, and forecasting. Core features include: › Painless time tracking. Timesheets offers a better overview of work time for billing, measuring costs, internal time, and work performed. › Flexible reporting. Drill down on estimated versus actual time spent on JIRA issues, billable time, and more. › Cost center management. Gain better visibility of all activities and work performed for customers, internal projects, and development. Thank you to Maxime-Samuel Nie-Rouquette from Tempo for writing this guest blog post! At ACA, we also use Tempo Timesheets for our billing and invoicing, and are a Silver Partner as well. We’ve developed our own add-on to Tempo Timesheets that allows users to customize their Tempo work log fields, add custom Javascript to Jira and adapt Jira’s style and behaviour. {% module_block module "widget_0f7c6165-e281-4e27-97b2-1e28292767b8" %}{% module_attribute "buttons" is_json="true" %}{% raw %}[{"appearance":{"link_color":"light","primary_color":"primary","secondary_color":"primary","tertiary_color":"light","tertiary_icon_accent_color":"dark","tertiary_text_color":"dark","variant":"primary"},"content":{"arrow":"right","icon":{"alt":null,"height":null,"loading":"disabled","size_type":null,"src":"","width":null},"tertiary_icon":{"alt":null,"height":null,"loading":"disabled","size_type":null,"src":"","width":null},"text":"Check out our Tempo add-on"},"target":{"link":{"no_follow":false,"open_in_new_tab":true,"rel":"noopener","sponsored":false,"url":{"content_id":null,"href":"https://marketplace.atlassian.com/apps/1216590/custom-js-for-jira?hosting=server tab=overview","href_with_scheme":"https://marketplace.atlassian.com/apps/1216590/custom-js-for-jira?hosting=server tab=overview","type":"EXTERNAL"},"user_generated_content":false}},"type":"normal"}]{% endraw %}{% end_module_attribute %}{% module_attribute "child_css" is_json="true" %}{% raw %}{}{% endraw %}{% end_module_attribute %}{% module_attribute "css" is_json="true" %}{% raw %}{}{% endraw %}{% end_module_attribute %}{% module_attribute "definition_id" is_json="true" %}{% raw %}null{% endraw %}{% end_module_attribute %}{% module_attribute "field_types" is_json="true" %}{% raw %}{"buttons":"group","styles":"group"}{% endraw %}{% end_module_attribute %}{% module_attribute "isJsModule" is_json="true" %}{% raw %}true{% endraw %}{% end_module_attribute %}{% module_attribute "label" is_json="true" %}{% raw %}null{% endraw %}{% end_module_attribute %}{% module_attribute "module_id" is_json="true" %}{% raw %}201493994716{% endraw %}{% end_module_attribute %}{% module_attribute "path" is_json="true" %}{% raw %}"@projects/aca-group-project/aca-group-app/components/modules/ButtonGroup"{% endraw %}{% end_module_attribute %}{% module_attribute "schema_version" is_json="true" %}{% raw %}2{% endraw %}{% end_module_attribute %}{% module_attribute "smart_objects" is_json="true" %}{% raw %}null{% endraw %}{% end_module_attribute %}{% module_attribute "smart_type" is_json="true" %}{% raw %}"NOT_SMART"{% endraw %}{% end_module_attribute %}{% module_attribute "tag" is_json="true" %}{% raw %}"module"{% endraw %}{% end_module_attribute %}{% module_attribute "type" is_json="true" %}{% raw %}"module"{% endraw %}{% end_module_attribute %}{% module_attribute "wrap_field_tag" is_json="true" %}{% raw %}"div"{% endraw %}{% end_module_attribute %}{% end_module_block %}
Read moreWant to dive deeper into this topic?
Get in touch with our experts today. They are happy to help!

Want to dive deeper into this topic?
Get in touch with our experts today. They are happy to help!

Want to dive deeper into this topic?
Get in touch with our experts today. They are happy to help!

Want to dive deeper into this topic?
Get in touch with our experts today. They are happy to help!

