


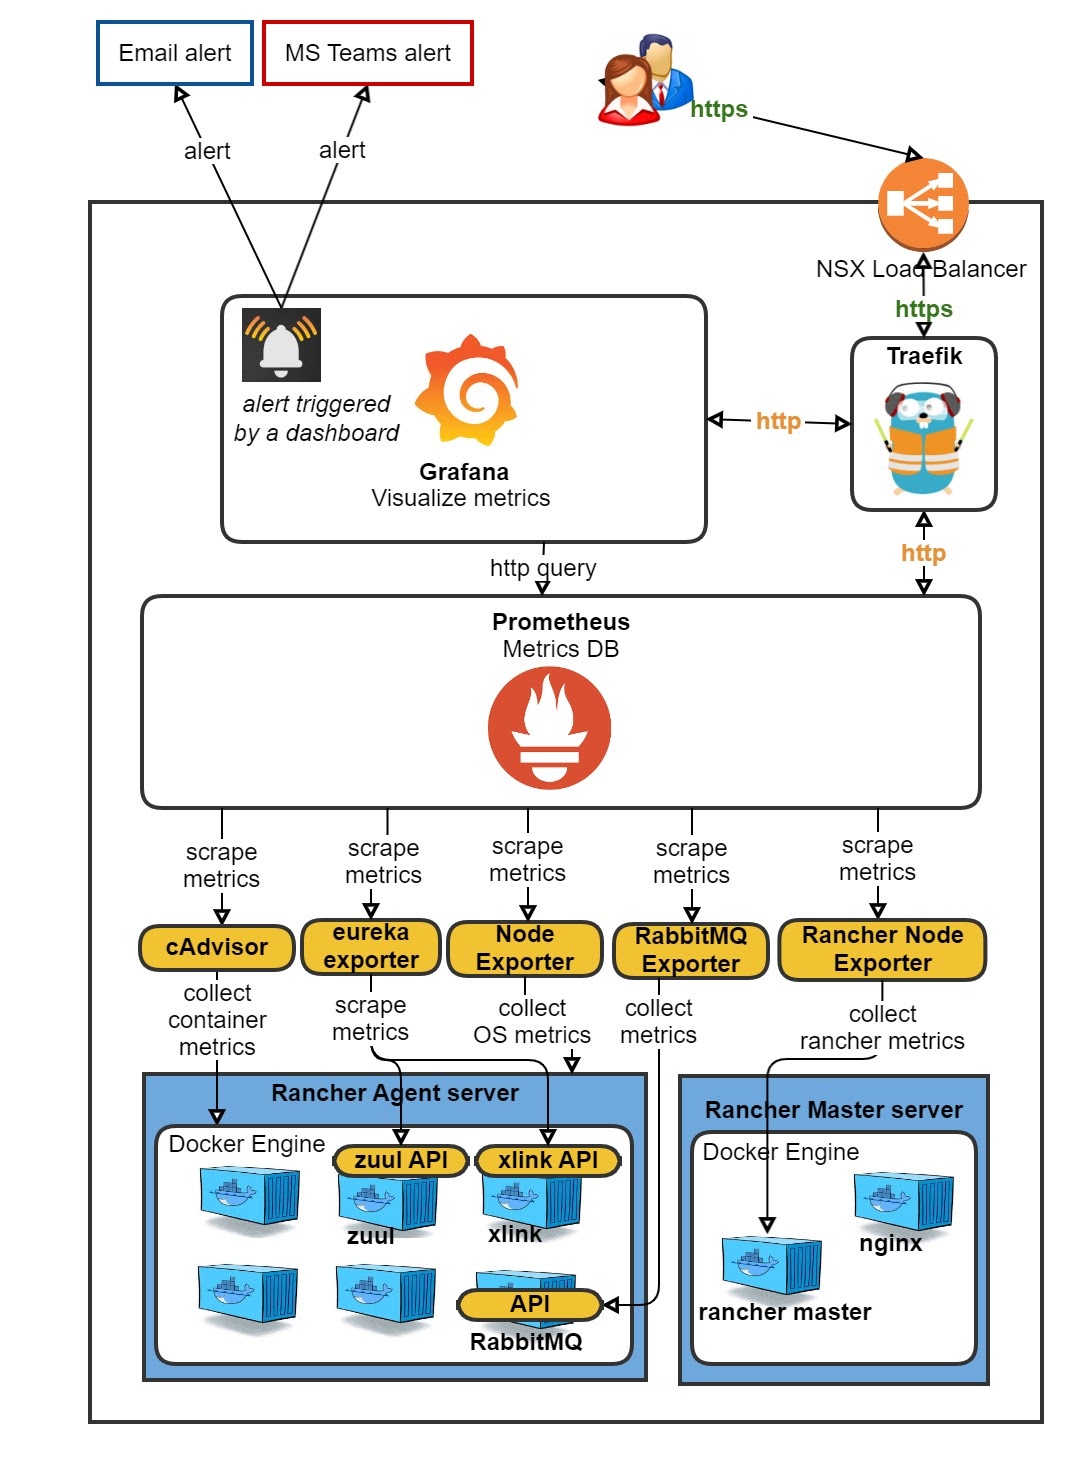
The problem with that is that this is all rather ‘standard’. When you already have a fully customized Prometheus/Grafana setup in Rancher 1, such as we do, it seems a waste to throw this out the window. The journey from a Rancher 1 ‘cattle’ Prometheus/Grafana to Rancher 2 K8s went very smooth and was fairly easy.
However, with Prometheus, you historically would have to edit the prometheus.yaml file every time you want to scrape a new application, unless you had already added your own custom discovery tool as a scrape.
Fixing the incomplete data with auto-discovery
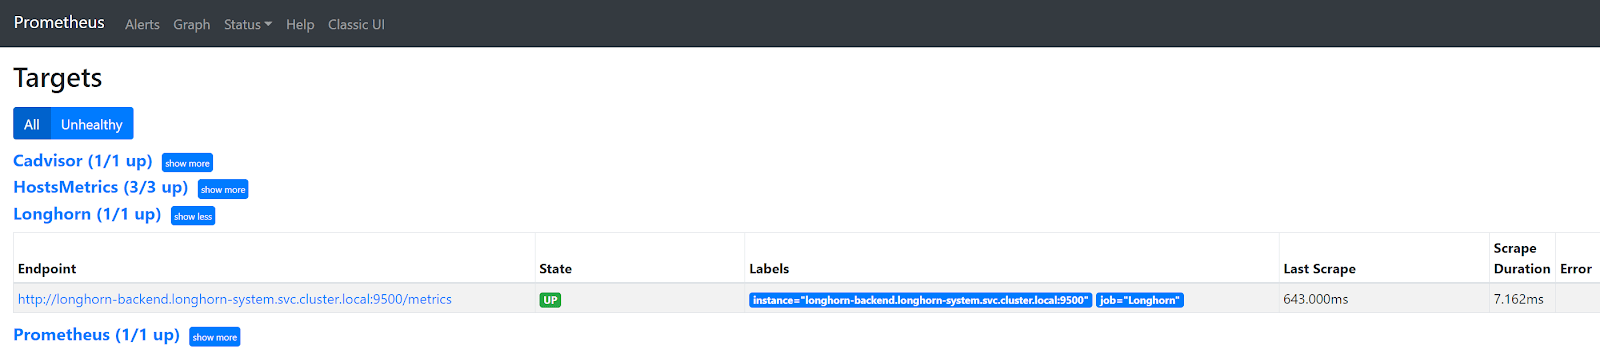
A problem that I faced with directly scraping a Longhorn and Spring Boot (or any other) Service in K8s, is that only one of the many backend pods behind that Service is scraped. So, you end up with incomplete data in Prometheus and hence incomplete data in your dashboards in Grafana. In Prometheus, you can see that only one of three existing Longhorn endpoints is scraped.

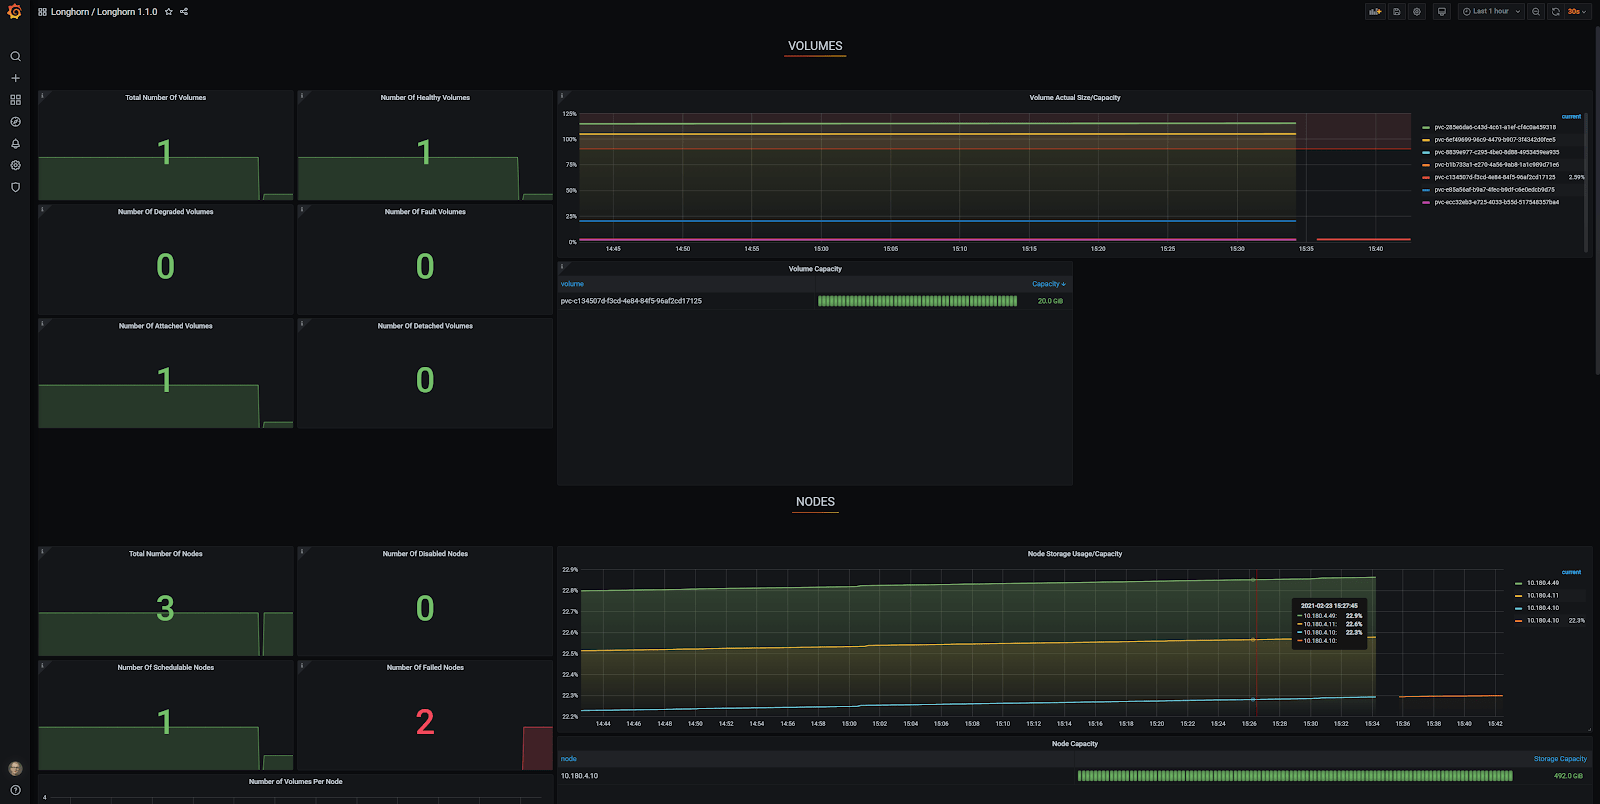
In Grafana, you can see that there is only one node accounted for and the other two are reported as ‘Failed Nodes’. To make matters worse, only one of seven volumes is reported at ‘Total Number of Volumes’.

This is where auto-discovery of Kubernetes endpoint services comes in as a true savior. Many web pages describe the various aspects of scraping, but I found none of them complete and others had critical errors.
In this blog post, I’ll provide you with a minimal and simple configuration to bring your Prometheus configuration with auto-discovery of Kubernetes endpoint services up to speed.
1. Include configMap additions for Prometheus
Add this to the end of the prometheus.yaml in your Prometheus configMap. The jobname is ‘kubernetes-service-endpoints’ as it seemed appropriate.
# Scrape config for service endpoints.
#
# The relabeling allows the actual service scrape endpoint to be configured
# via the following annotations:
#
# * `prometheus.io/scrape`: Only scrape services that have a value of `true`
# * `prometheus.io/scheme`: If the metrics endpoint is secured then you will need
# to set this to `https` & most likely set the `tls_config` of the scrape config.
# * `prometheus.io/path`: If the metrics path is not `/metrics` override this.
# * `prometheus.io/port`: If the metrics are exposed on a different port to the
# service then set this appropriately.
- job_name: 'kubernetes-service-endpoints'
scrape_interval: 5s
scrape_timeout: 2s
kubernetes_sd_configs:
- role: endpoints
relabel_configs:
- source_labels: [__meta_kubernetes_service_annotation_prometheus_io_scrape]
action: keep
regex: true
- source_labels: [__meta_kubernetes_service_annotation_prometheus_io_scheme]
action: replace
target_label: __scheme__
regex: (https?)
- source_labels: [__meta_kubernetes_service_annotation_prometheus_io_path]
action: replace
target_label: __metrics_path__
regex: (.+)
- source_labels: [__address__, __meta_kubernetes_service_annotation_prometheus_io_port]
action: replace
target_label: __address__
regex: (.+)(?::\d+);(\d+)
replacement: $1:$2
- action: labelmap
regex: __meta_kubernetes_service_label_(.+)
- source_labels: [__meta_kubernetes_namespace]
action: replace
target_label: kubernetes_namespace
- source_labels: [__meta_kubernetes_service_name]
action: replace
target_label: kubernetes_name
2. Configure the Services
As in the comment above of the prometheus.yaml, you can configure the following annotations. The annotation prometheus.io/scrape: “true” is mandatory, if you want to scrape a particular service. All the other annotations are optional and explained here:
- prometheus.io/scrape: Only scrape services that have a value of `true`
- prometheus.io/scheme: If the metrics endpoint is secured then you will need to set this to `https` & most likely set the `tls_config` of the scrape config.
- prometheus.io/path: If the metrics path is not `/metrics` override this.
- prometheus.io/port: If the metrics are exposed on a different port to the service then set this appropriately.
Let’s look at an example for a Longhorn Service first. (Longhorn is a great replicated storage solution!)
apiVersion: v1
kind: Service
metadata:
annotations:
prometheus.io/port: "9500"
prometheus.io/scrape: "true"
labels:
app: longhorn-manager
name: longhorn-backend
namespace: longhorn-system
spec:
ports:
- name: manager
port: 9500
protocol: TCP
targetPort: manager
selector:
app: longhorn-manager
sessionAffinity: ClientIP
sessionAffinityConfig:
clientIP:
timeoutSeconds: 10800
type: ClusterIP
Next, let’s look at an example for a Spring Boot Application Service. Note the non-standard scrape path /actuator/prometheus.
apiVersion: v1
kind: Service
metadata:
name: springbootapp
namespace: spring
labels:
app: gateway
annotations:
prometheus.io/path: "/actuator/prometheus"
prometheus.io/port: "8080"
prometheus.io/scrape: "true"
spec:
ports:
- name: management
port: 8080
- name: http
port: 80
selector:
app: gateway
sessionAffinity: None
type: ClusterIP
3. Configure Prometheus roles
ClusterRole
First, change the namespace as needed. Note: possibly this clusterRole needs to be a little tighter than it currently is.
apiVersion: rbac.authorization.k8s.io/v1
kind: ClusterRole
metadata:
labels:
app.kubernetes.io/component: controller
app.kubernetes.io/name: prometheus
name: prometheus
namespace: prometheus
rules:
- apiGroups:
- apiextensions.k8s.io
resources:
- customresourcedefinitions
verbs:
- create
- apiGroups:
- apiextensions.k8s.io
resourceNames:
- alertmanagers.monitoring.coreos.com
- podmonitors.monitoring.coreos.com
- prometheuses.monitoring.coreos.com
- prometheusrules.monitoring.coreos.com
- servicemonitors.monitoring.coreos.com
- thanosrulers.monitoring.coreos.com
resources:
- customresourcedefinitions
verbs:
- get
- update
- apiGroups:
- monitoring.coreos.com
resources:
- alertmanagers
- alertmanagers/finalizers
- prometheuses
- prometheuses/finalizers
- thanosrulers
- thanosrulers/finalizers
- servicemonitors
- podmonitors
- prometheusrules
verbs:
- '*'
- apiGroups:
- apps
resources:
- statefulsets
verbs:
- '*'
- apiGroups:
- ""
resources:
- configmaps
- secrets
verbs:
- '*'
- apiGroups:
- ""
resources:
- pods
verbs:
- get
- list
- watch
- apiGroups:
- ""
resources:
- services
- services/finalizers
- endpoints
verbs:
- "*"
- apiGroups:
- ""
resources:
- nodes
verbs:
- list
- watch
- apiGroups:
- ""
resources:
- namespaces
verbs:
- get
- list
- watch
- apiGroups:
- extensions
resources:
- ingresses
verbs: ["get", "list", "watch"]
- nonResourceURLs: ["/metrics"]
verbs: ["get"]
ClusterRoleBinding
Again, change the namespace as needed.
apiVersion: rbac.authorization.k8s.io/v1
kind: ClusterRoleBinding
metadata:
labels:
app.kubernetes.io/component: controller
app.kubernetes.io/name: prometheus
name: prometheus
namespace: prometheus
roleRef:
apiGroup: rbac.authorization.k8s.io
kind: ClusterRole
name: prometheus
subjects:
- kind: ServiceAccount
name: default
namespace: prometheus
ServiceAccount
Once more, change the namespace as needed. DO NOT change the name unless you change the ClusterRoleBinding subjects.name as well.
apiVersion: v1
kind: ServiceAccount
metadata:
name: default
namespace: prometheus
Apply
First, apply the ServiceAccount, ClusterRoleBinding, ClusterRole and Services to your K8s cluster. After updating the Prometheus configMap, redeploy Prometheus to make sure that the new configMap is activated/loaded.
Results in Prometheus
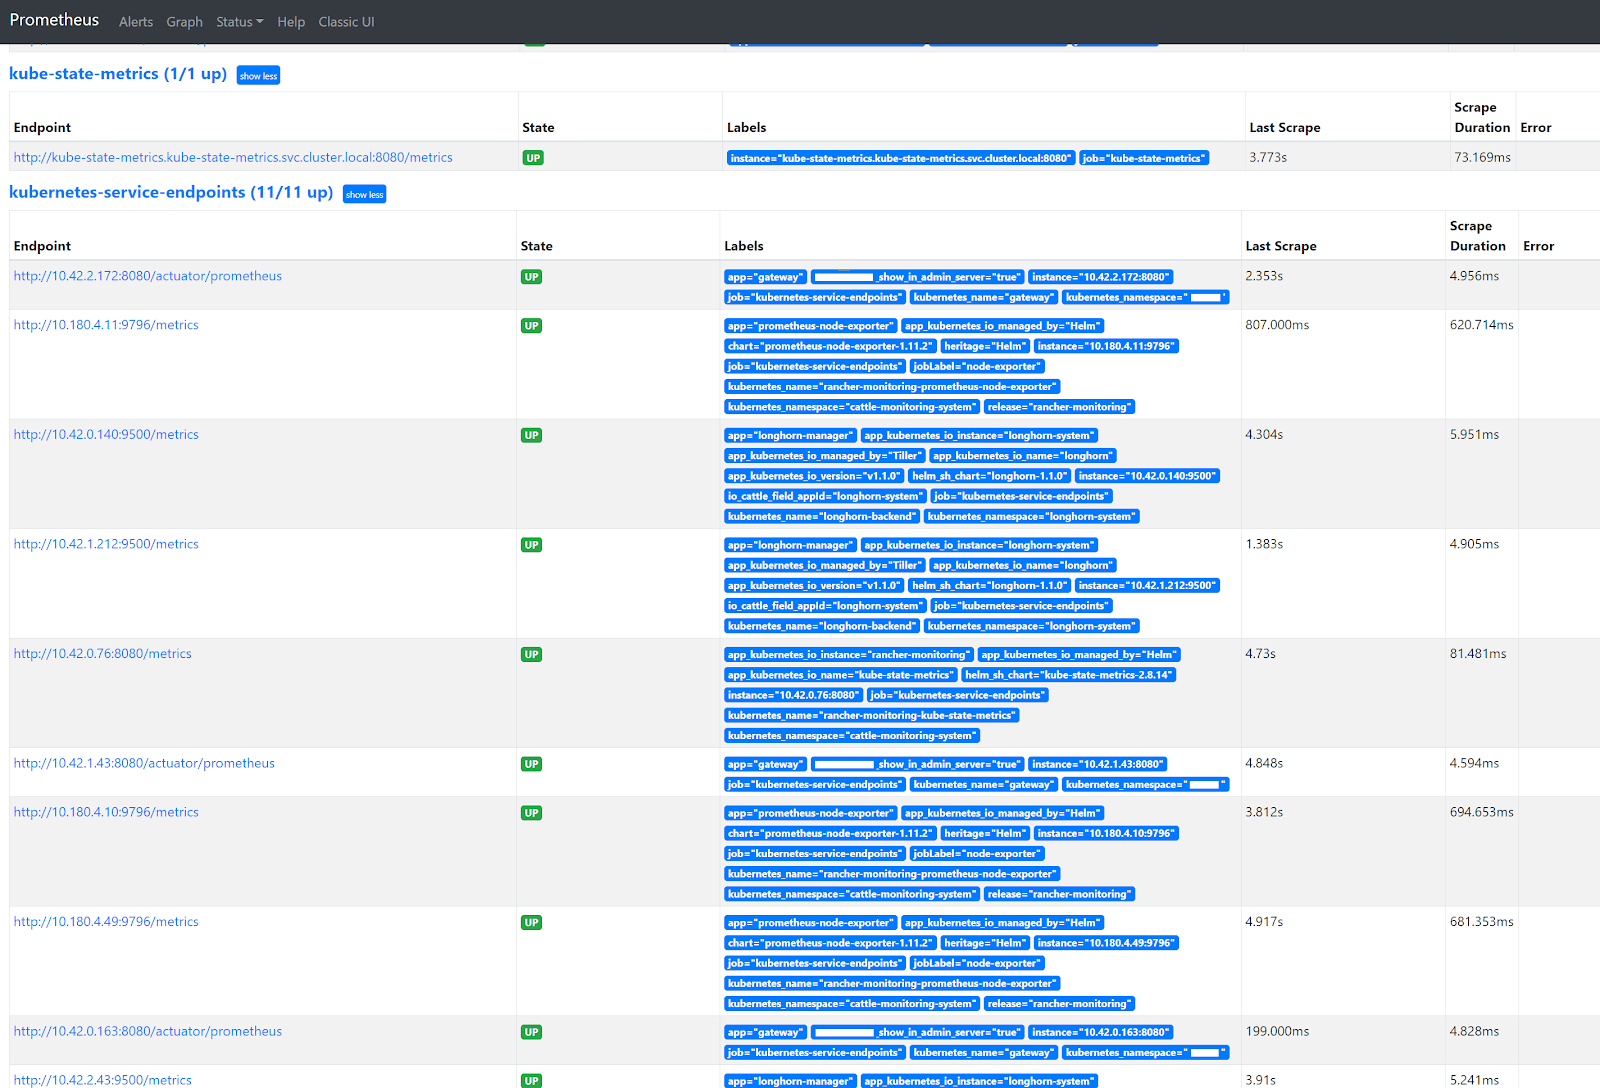
Go to the Prometheus GUI and navigate to Status -> Targets. You’ll see that now all the pod endpoints ‘magically’ pop up at the kubernetes-services-endpoints heading. Any future prometheus.io related annotation changes in k8s Services will immediately come into effect after applying them!

Grafana Longhorn dashboard
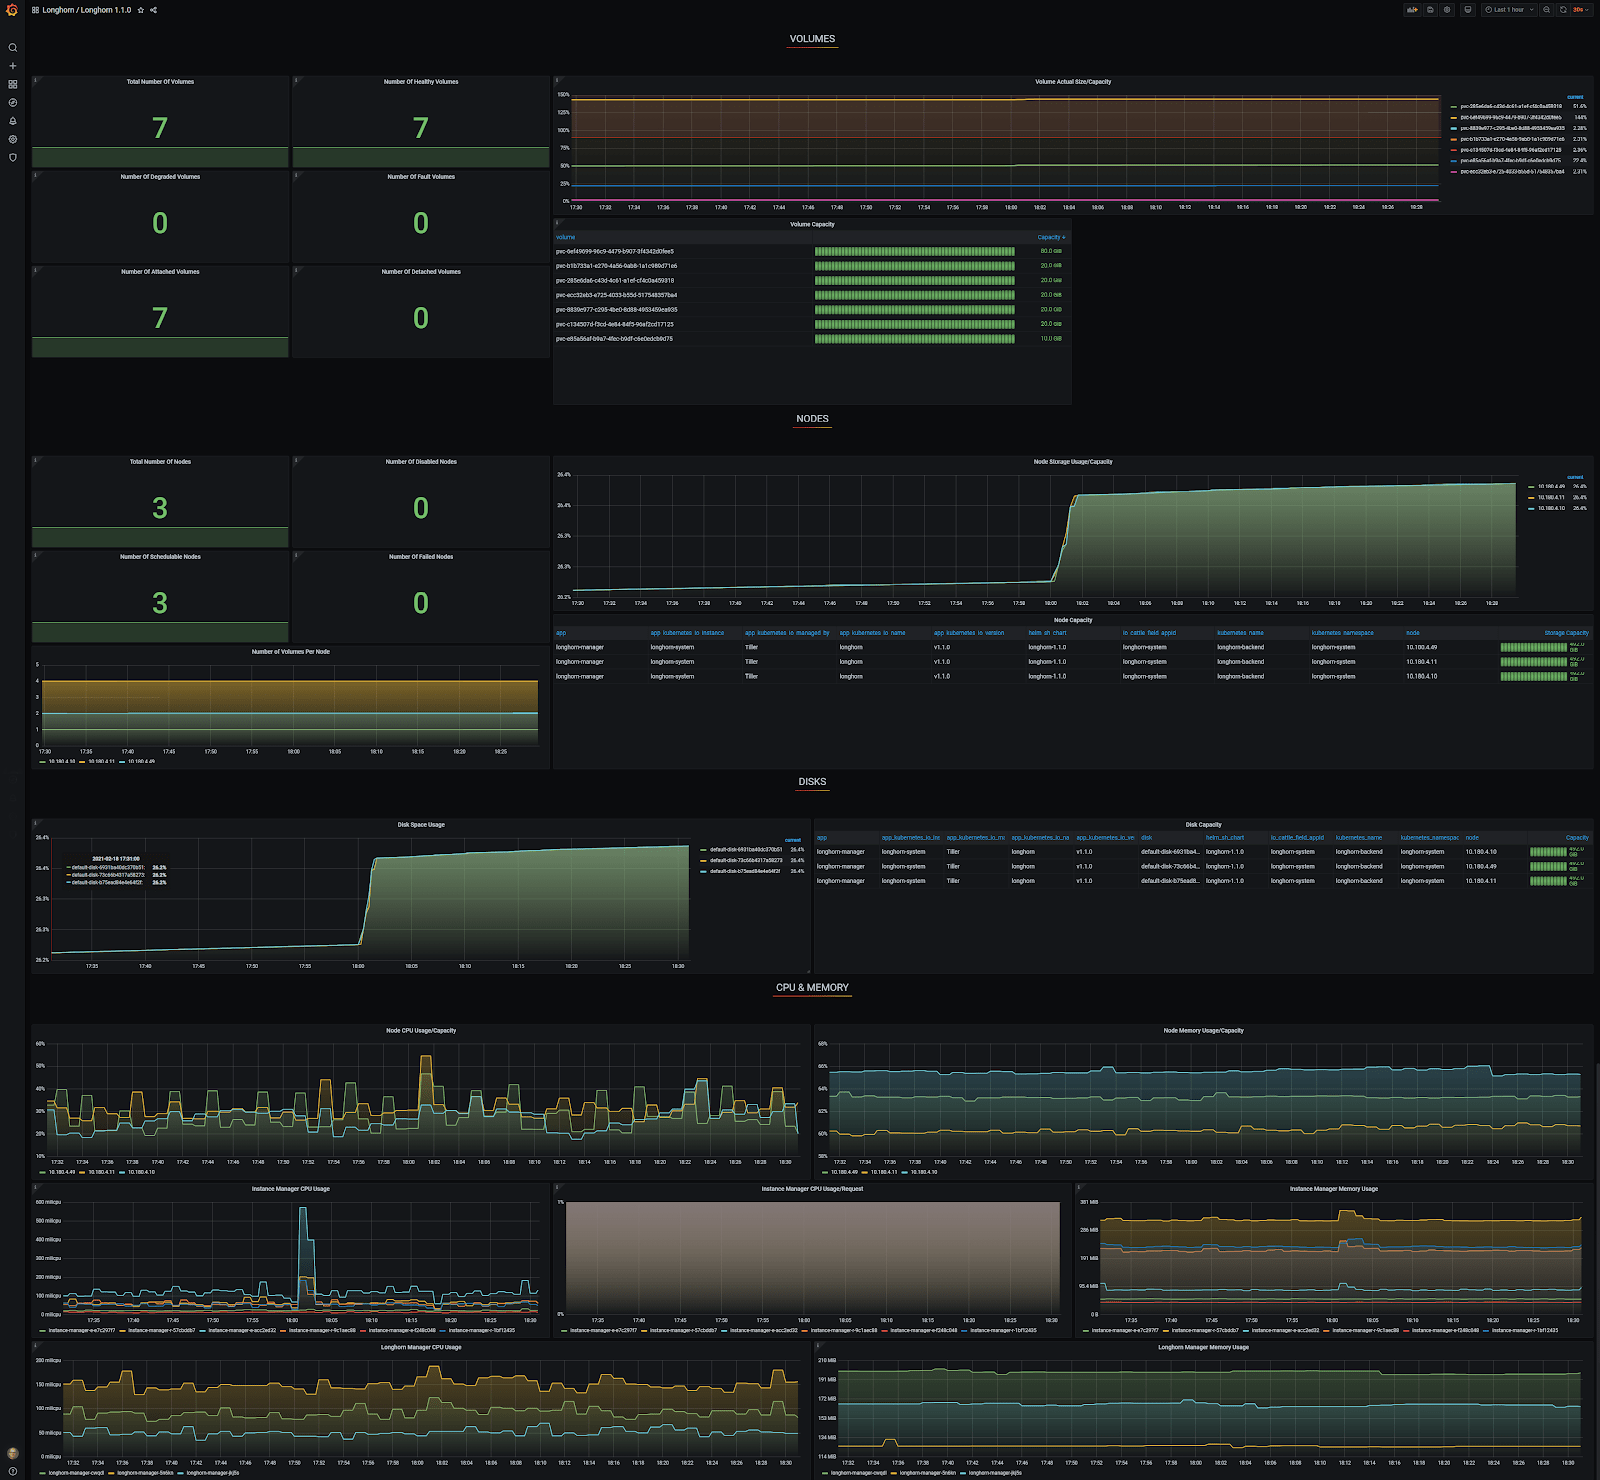
I used a generic Grafana Longhorn dashboard, which you can find here for yourself. Thanks to the auto-discovery, the Grafana Longhorn dashboard now correctly shows three nodes and seven volumes, which is exactly correct!

Conclusion
After running through all the steps in this blog post, you basically never have to look at your Prometheus configuration again. With auto-discovery of Kubernetes endpoint services, adding and removing Prometheus scrapes for your applications has now become almost as simple as unlocking your cell phone!
I hope this blog post has helped you out! If you have any questions, reach out to me. Or, if you’d like professional advice and services, see how we can help you out with Kubernetes.

What others have also read


CloudBrew has always been a highlight on our calendar, but the 2025 edition felt different. Perhaps it was the timing. Just the month prior, November 2025, the Azure Belgium Central region finally opened its doors. ACA has always operated from the heart of Europe, so seeing this massive national milestone go live just before the conference added a layer of excitement.
Read more

Better uptime, lower costs, and avoiding vendor lock-in. These are three of the reasons why our customers opt for a multicloud strategy. Our Cloud Project Manager Roel Van Steenberghe explains what such a strategy entails and what the advantages of Google Cloud Platform (GCP) are.
Read more

In the complex world of modern software development, companies are faced with the challenge of seamlessly integrating diverse applications developed and managed by different teams. An invaluable asset in overcoming this challenge is the Service Mesh. In this blog article, we delve into Istio Service Mesh and explore why investing in a Service Mesh like Istio is a smart move." What is Service Mesh? A service mesh is a software layer responsible for all communication between applications, referred to as services in this context. It introduces new functionalities to manage the interaction between services, such as monitoring, logging, tracing, and traffic control. A service mesh operates independently of the code of each individual service, enabling it to operate across network boundaries and collaborate with various management systems. Thanks to a service mesh, developers can focus on building application features without worrying about the complexity of the underlying communication infrastructure. Istio Service Mesh in Practice Consider managing a large cluster that runs multiple applications developed and maintained by different teams, each with diverse dependencies like ElasticSearch or Kafka. Over time, this results in a complex ecosystem of applications and containers, overseen by various teams. The environment becomes so intricate that administrators find it increasingly difficult to maintain a clear overview. This leads to a series of pertinent questions: What is the architecture like? Which applications interact with each other? How is the traffic managed? Moreover, there are specific challenges that must be addressed for each individual application: Handling login processes Implementing robust security measures Managing network traffic directed towards the application ... A Service Mesh, such as Istio, offers a solution to these challenges. Istio acts as a proxy between the various applications (services) in the cluster, with each request passing through a component of Istio. How Does Istio Service Mesh Work? Istio introduces a sidecar proxy for each service in the microservices ecosystem. This sidecar proxy manages all incoming and outgoing traffic for the service. Additionally, Istio adds components that handle the incoming and outgoing traffic of the cluster. Istio's control plane enables you to define policies for traffic management, security, and monitoring, which are then applied to the added components. For a deeper understanding of Istio Service Mesh functionality, our blog article, "Installing Istio Service Mesh: A Comprehensive Step-by-Step Guide" , provides a detailed, step-by-step explanation of the installation and utilization of Istio. Why Istio Service Mesh? Traffic Management: Istio enables detailed traffic management, allowing developers to easily route, distribute, and control traffic between different versions of their services. Security: Istio provides a robust security layer with features such as traffic encryption using its own certificates, Role-Based Access Control (RBAC), and capabilities for implementing authentication and authorization policies. Observability: Through built-in instrumentation, Istio offers deep observability with tools for monitoring, logging, and distributed tracing. This allows IT teams to analyze the performance of services and quickly detect issues. Simplified Communication: Istio removes the complexity of service communication from application developers, allowing them to focus on building application features. Is Istio Suitable for Your Setup? While the benefits are clear, it is essential to consider whether the additional complexity of Istio aligns with your specific setup. Firstly, a sidecar container is required for each deployed service, potentially leading to undesired memory and CPU overhead. Additionally, your team may lack the specialized knowledge required for Istio. If you are considering the adoption of Istio Service Mesh, seek guidance from specialists with expertise. Feel free to ask our experts for assistance. More Information about Istio Istio Service Mesh is a technological game-changer for IT professionals aiming for advanced control, security, and observability in their microservices architecture. Istio simplifies and secures communication between services, allowing IT teams to focus on building reliable and scalable applications. Need quick answers to all your questions about Istio Service Mesh? Contact our experts
Read moreWant to dive deeper into this topic?
Get in touch with our experts today. They are happy to help!

Want to dive deeper into this topic?
Get in touch with our experts today. They are happy to help!

Want to dive deeper into this topic?
Get in touch with our experts today. They are happy to help!

Want to dive deeper into this topic?
Get in touch with our experts today. They are happy to help!


